36 Years of Stock Market Returns in Canada (TSX)

What is the average stock market return?
It’s one of the first questions I usually get from people who are just starting to wrap their heads around investing for the long term.
But in my experience, what most folks really want to know is something a bit different. They’re not just asking, “What percentage has historically occurred over the long run?” It’s more along the lines of: “How bad can this get if I happen to invest right before things go downhill?” To see Canada’s average stock market at a glance, you can skip ahead to the graph I put together showing what the last 37 years have looked like.
Before we get to the mathematical returns though, it’s worth slowing down for a minute and defining what we actually mean by “the stock market.” When I’m talking to Canadians who are brand new to investing, I usually start with the basics: A stock is a tiny ownership piece of a company and a stock market is simply where those ownership pieces get bought and sold. The other main investment type most people need to know is a bond, and bonds are simply loans to governments or companies (usually).
Where things get a bit messy is that “the stock market” is not one perfectly defined thing. In the U.S., people often use the phrase as shorthand for the S&P 500, the Dow, the Nasdaq, the New York Stock Exchange, or sometimes the entire U.S. market. Those are related ideas, but they are not identical marketplaces for stocks. So when someone says, “the stock market returned X%,” the first follow-up questions that should be asked are:
Which stock market?
Which group of stocks?
Over what time period?
In Canada, most regular investors are talking about the Toronto Stock Exchange when they refer to the Canadian stock market. There are other Canadian marketplaces including the TSX Venture Exchange for smaller and earlier-stage companies, and the Montreal Exchange for exotic investments such as options and futures. But if we’re talking about the big public Canadian companies that most investors recognize, the Toronto Stock Exchange (TSX) is really the one to know about.
In order to be precise about answering our average stock market returns question though, we have to define which stocks on the TSX we are talking about. The group of stocks most people would refer to as “The Canadian Stock Market” are probably the 60 biggest stocks on the Toronto Stock Exchange. This group is commonly called the TSX 60.
The better measure of the entirety of Canada’s publicly traded stocks is the broader S&P/TSX Composite Index. It includes about 220 (as of July 2026) of the larger and more actively traded TSX-listed securities, so it’s a little more holistic than just the TSX 60. That’s the group of stocks we’re going to be looking at quantifying the return of as we look at average price returns plus dividends of the Canadian stock market.
How to Measure Stock Market Returns?
Ok, so now we know that when we’re talking about “the stock market” it can mean a lot of things. We might be talking about just the US stock market (or even just a part of the US stock market). We might be referring to a collection of the biggest individual stock markets in the world. Or, for some of us, we might just be referring to the 60 biggest stocks in Canada – or my preference – using the S&P/TSX Composite Index.
Once we’re clear on just what stocks we’re measuring, then we have to understand the difference between price return and total return.
Remember, you can make money from stocks in two ways:
1) You buy a stock at a lower price and then sell it at a higher price. This is called a capital gain.
2) You buy a stock and enjoy being an owner of a company. Many large companies pay out part of the profits to their owners every year. This profit money being paid to you is called a dividend.
Now, when we talk about an index or an entire stock market return, we’re usually referring to a group of stocks. A lot of the time if we were to look up historical stock returns, it will only show us the capital gains – or “price returns” – that we would’ve gotten, had we invested in that group of stocks at one time, and then sold it later.
For example, if I invested in all of the stocks in the S&P/TSX Composite Index on January 1st 2021, and sold my stocks on December 31, 2021, I would have sold them for about 22% more than I paid for them. That’s the price return.
It’s actually pretty easy to buy or sell entire groups of stocks using ETFs. Check out our list of the Best ETFs in Canada for more details. But the more accurate statistic is the total return of a group of stocks. That’s what we get when we add the dividends we would have collected as owners of companies, to our price returns (that we would have got from buying and selling). After all, the total return is what you would have seen pop up in your online brokerage account – not just the price return.
TSX Stocks Return on Investment (ROI)
Below you can see what your total return on investment would have been, had you invested in the S&P/TSX Composite Index in any given year since 1988. These are known as annualized returns. In other words, what the return you would have gotten if we divided it up over the number of years invested.
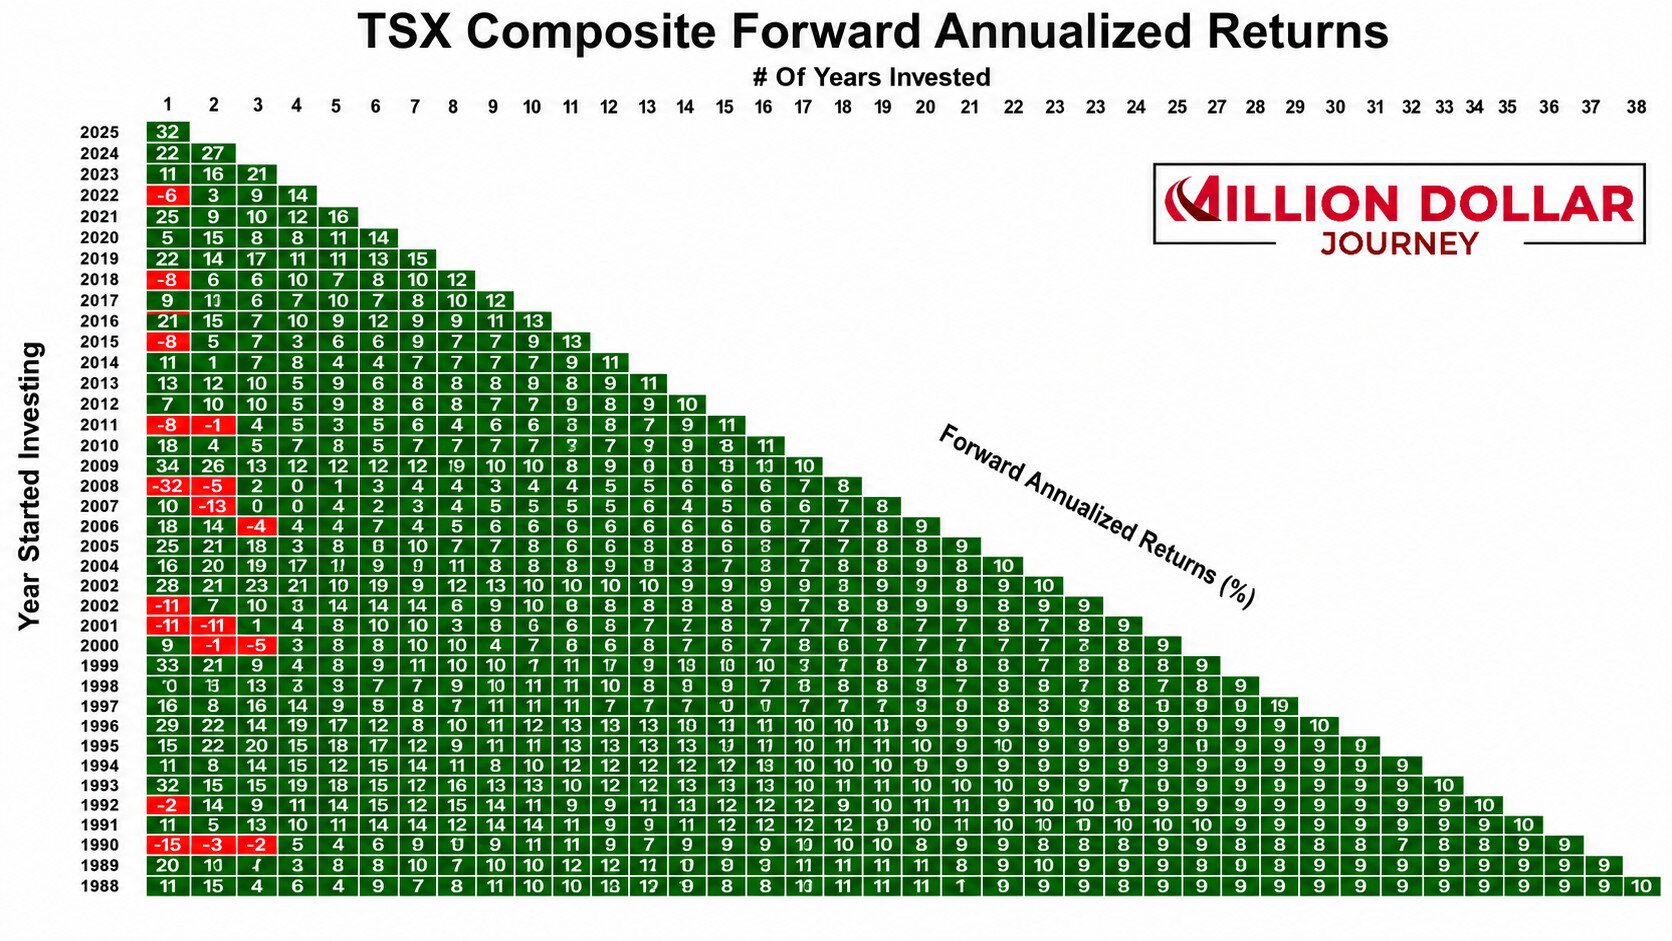
Now, I need to point out that while I created this chart myself (with the help of ChatGPT and data from S&P Global), I got the idea from an author named Ben Carlson. Ben is an American author who writes at AWealthOfCommonSense.com. He’s a smart guy and he recently published this post looking at US stock market returns. He also created this chart:
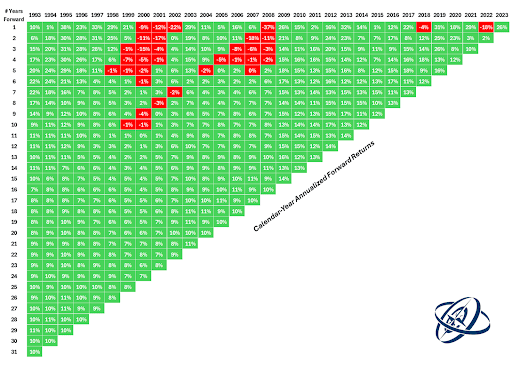
Here are some of the major takeaways of these two graphs:
1) There have been some really bad one-year periods in the stock market. In 2008 the Canadian stock market lost 32% of its value, while the US stock market lost 37%.
2) BUT – even if you started investing in that awful year of 2008, you’d still be doing pretty well. In the USA you’d have averaged a very solid 8% per year, and in Canada, a still-respectable 7% per year.
3) Another awful time to be an investor was in 2000-2002. The big tech bubble burst in the US, and their stock market actually saw a “lost decade” where your return over a 10-year stretch would have been 0-1%. Even in this situation though, if you had started investing during this worst-possible time in the last 31 years, you’d still have averaged 7% per year if you had held through to today. In Canada, we saw much less of a bubble, and so we skipped the “lost decade” on our way to a smoother 8% annualized return.
4) You can see why we have the rule of thumb that says, “Don’t put money in the stock market if you need it in the next 5 years.”
5) If you have a long enough time horizon, annualized returns start to inevitably return to the mean.
6) While the stock market returns for the TSX were less overall than the returns for US stocks, they also had less dramatic downturns. We see the longest period where we have negative annualized returns for Canadian stocks is 3 years, while the US suffered through that lost decade from 2000-2010.
7) 10-year annualized returns ranged from 5% to 14% on the TSX, and US stocks ranged from -1% to 17%. That’s an interesting overall look at the variability you have to be aware of when discussing historical stock market returns.
8) Since the “Lost Decade” in the US, American stocks have been on an unbelievable tear. Any money you put to work in 2009-2020 has done fantastically well!
Real vs Nominal Stock Market Returns
It’s worth noting that up until this point we’ve been discussing stock market returns in the context of a pure percentage increase – and not factoring in inflation. That type of non-inflation adjusted statistics is called a “nominal” number. Of course that’s not really how the real world works.
If we adjust stock market returns for inflation (subtracting how much inflation was during that time) we refer to the new inflation-adjusted statistic as “real”.
Rookies talk only nominal returns – pros look at real returns over the long term.
The Credit Suisse Global Investment Returns Yearbook for looked back at the last 123 years of data and revealed:
Stocks have had a real annual return of 5%.
Bonds have had a real annual return of 1.7%
Jeremey Siegel recently updated his much-quoted book, called Stocks for the Long Run: The Definitive Guide to Financial Market Returns & Long-Term Investment Strategies. He points out:
- Over the last 200 years, American stocks have had a real annual return of 6.7%
- US Bonds have a real annual return of about 3%
Those real stock market return numbers are probably a more accurate way to think about long-term investment returns than talking about nominal “10% per year” type of numbers.
Canadian Average Stock Market Returns Q/A
What Are Typical Stock Market Returns?
You might hear someone say that the average stock market return of the last 100 years is 10%. A more accurate statement would be that the average nominal stock market return of the main US stock markets has been 10% over the last 100 years.
Canada’s is usually lower – depending what time period you use. We trail the US by a substantial amount over the last 10 years, and the same holds true over the last 20 years. Over the last 50 years Canada has actually posted an excellent 10.3% nominal return, whereas the US is over 13%!
That said, the question of “typical” stock market returns is a little more nuanced than just a long term average. Remember that while 10% might be the average, in any given year the ROI could be vastly different from that long-term average. You can see from the above graph that the annual stock market return is usually much higher or much lower than 10%.
I’d prefer to use a more accurate statement like, “If you invest in Canadian and American stocks and hold those stocks for 20+ years, then there is a very high probability that your average real return will be 5-6% – or 5-6% above inflation.
What Will Stock Market Returns Be in the Next Few Years?
Anyone who tells you that they know what the next few years will look like for stock market returns is either dumb or lying. There is just no way to predict short-term stock market gyrations. But here’s some food for thought…
Look at the graph below and really try to think about how crazy some of these events are:
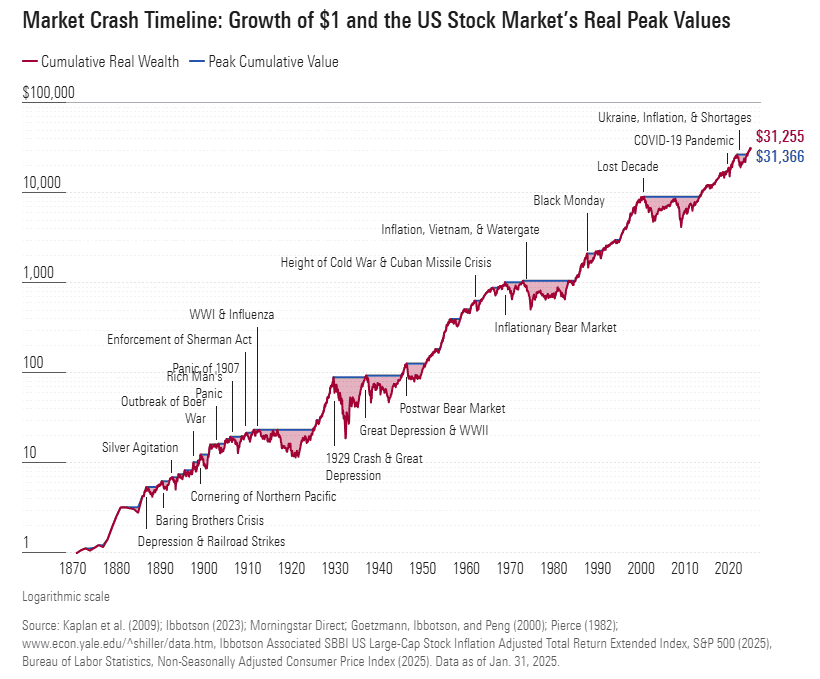
As crazy as I believe the Trump Tariffs and US Trade War are, and how much traffic our best investments for a recession article got couple of weeks ago, it’s key to keep it all in perspective. This isn’t a World War. This isn’t the Cuban Missile Crisis. As highly as tech stocks are valued, they’re still not even close to what we were looking at in 2000.
A few things to think about over the next year as the stock market bounces all over the place:
The broader Canadian market (and our ever-popular Best Canadian Dividend Stocks) are actually up slightly for the year – despite the chaos.
US stocks hit an all-time high just a couple of weeks ago.
The VEQT ETF – which holds essentially all of the world’s stocks (with a tilt towards Canadian stocks) is actually up about 14% so far this year
So don’t panic. If you need the money in the next 5 years, you should be looking at a low risk investment. If you’re looking at longer-term goal, then remember that big companies are really really good at making money!


Thank you Señor Prévost. Conservatively using 7% above inflation, 20 year horizon, 100% equities in a diversified global ETF. I have Dreams of Glory do I not? Always appreciate your articles.