Canadian Stock Market vs U.S. Stock Market in 2025
We Canadians might like to argue with our U.S. neighbours about who makes better beer or who plays better hockey but when it comes to your portfolio, the real argument is who gets the better returns, the Canadian stock market vs the U.S. stock market?
Both Canada and the U.S. are wealthy developed countries with stable governments, trustworthy financial systems, and reliable civil infrastructure.
That is, we don’t have violent dictators causing mayhem (all recent evidence to the contrary), we faithfully entrust our hard earned money to the banking system, and when we turn on a switch, the lights come on. We both value individuality, freedom of expression, and the right to pursue a fulfilling life.
Perhaps, most relevant to building wealth, both countries also have very entrenched property rights, advanced rule of law, and competitive corporate tax rates. We are very much alike.
So are the Canadian and U.S. stock markets also very similar – or are they different? How much should the average Canuck invest in the Canadian stock market versus the U.S. stock market?
Canada vs U.S. Stock Market Update
I’ve decided to update the post below (which I wrote a couple of years ago).
Interesting to note that while the U.S. Stock Market had been trouncing the Canadian stock market for several years, the Canadian market made up some major ground in 2022. The TSX Composite finished the year down 8.7% at about 19,400, whereas the S&P 500 level finished down nearly 20% at 3,840.
Obviously it wasn’t a great year for the vast majority of investable assets, but Canada’s outperformance was tied to a much lower reliance on tech and growth stocks, but so far, that same small allocation for tech stocks has held the Canadian market back versus our US counterparts. With 2023 in the rearview mirror, the TSX Composite Index is only up about 2.5%, whereas a big tech rebound has the S&P 500 up nearly 10%.
It’s very hard to say what 2025 holds, but I’m willing to bet that the overall returns will be quite similar by the time 2025 rolls around. Higher interest rates should be weighing more on tech valuations than on energy and financial companies. Consequently, we should start to see those overall share prices converge a bit more.
Best Way to Trade Canadian or US ETFs for Free
What’s in a Stock Market Anyway?
A country’s stock market technically consists of stocks of all publicly traded companies registered in that country. The performance of a stock market is tracked using an index: a subset or sampling of the stocks in the whole market.
An index that tracks every single company in a stock market would most accurately represent that market; but typically, a collection of largest companies in a stock market is so much bigger than the rest of the smaller companies, that a sampling of the largest companies closely represents the whole market.
Two indices are very popular for representing the Canadian stock market: the TSX 60 index and the S&P/TSX Composite index. The TSX 60 tracks 60 of the largest companies in Canada and the S&P/TSX Composite tracks about 250 large Canadian companies. The S&P 500 Index tracks about 500 U.S. companies and is the most popular index for representing the U.S. stock market.
Comparing Canadian Stock Market Returns Versus U.S. Stock Market Returns
Let the TSX Composite index represent the Canadian stock market and the S&P 500 index represent the U.S. stock market, how do these two indices compare? At the time of writing, the TSX Composite level is 19,920 and the S&P 500 level is at 4,205.
The Canadian index is higher!
Canada wins! Right?
Not so fast.
The level of an index has a complicated relationship to the prices of the stocks in the index. It’s more instructive to look at the percentage change in the index level over time.
The following graph compares index levels from October 2010 to October 2020. In that time, the Canadian index grew 23%, while the U.S. index climbed a whopping 176%! In the past ten years, the Canadian market grew sluggishly while the U.S. market nearly tripled.
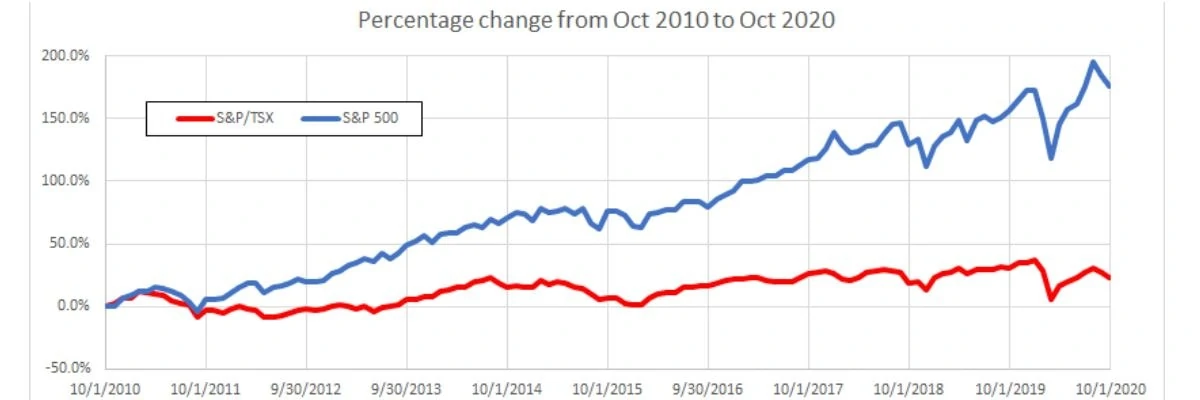
The approximate average annual returns in the last ten years are 2.1% for Canada and 10.7% for the U.S.
Note: these returns are calculated based on the index level only and do not include dividend payouts. Including dividend payout would narrow the gap between the Canadian and U.S. stock market returns as Canadian stocks typically pay out higher dividends compared to U.S. stocks.
Since 2010, the U.S. market clearly enjoyed higher growth compared to the Canadian market. What about other time periods? The following graphs compare the two country’s indices over different ten-year periods.
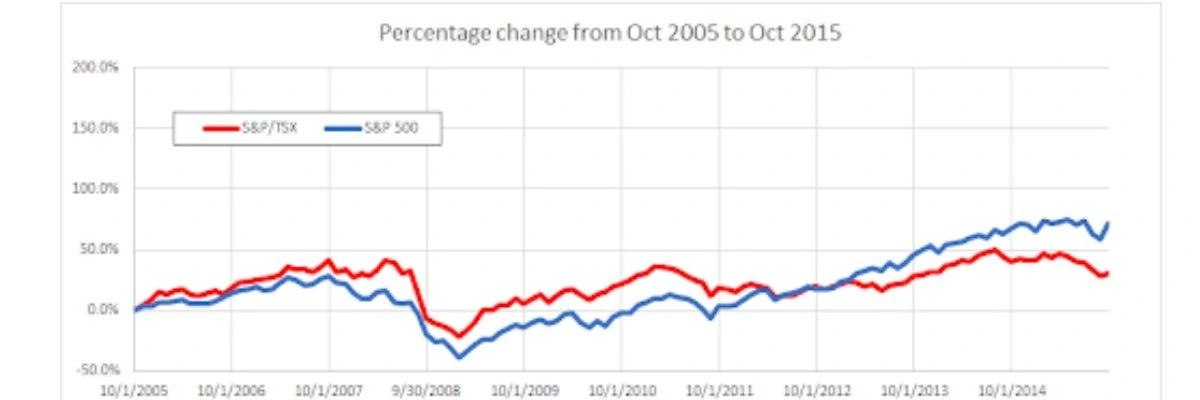
From October 2005 to October 2015, the Canadian index grew 30.3% while the U.S. index grew 72.3%. The respective average annual return is approximately 2.7% for Canada and 5.6% for the U.S.
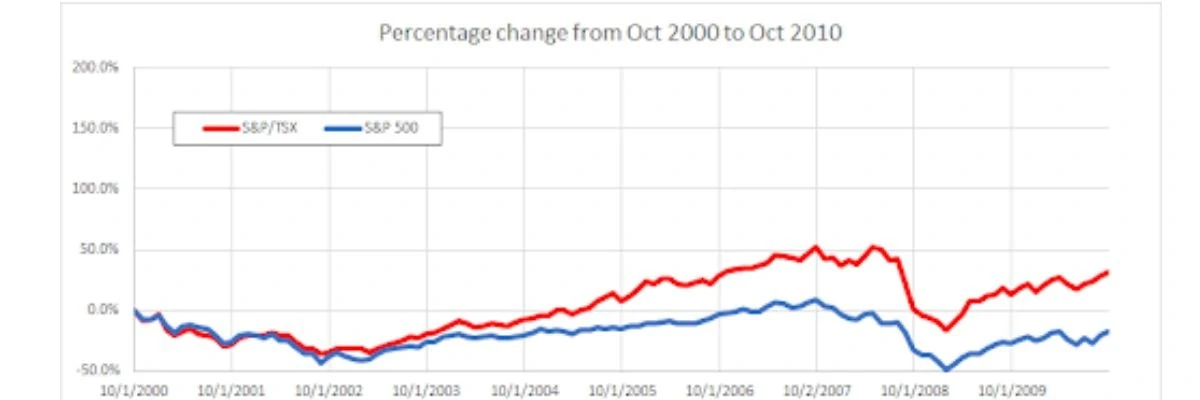
From October 2000 to October 2010, the Canadian index grew 31.5% while the U.S. index actually fell 17.2%. The respective average annual return is approximately 2.8% for Canada and -1.9% for the U.S.
The above two graphs include the 2008 financial crisis that shook the world financial system. Do you remember the cataclysmic mood at the time? Now, that apocalyptic financial crisis shows up as a trifling dip in the graph.
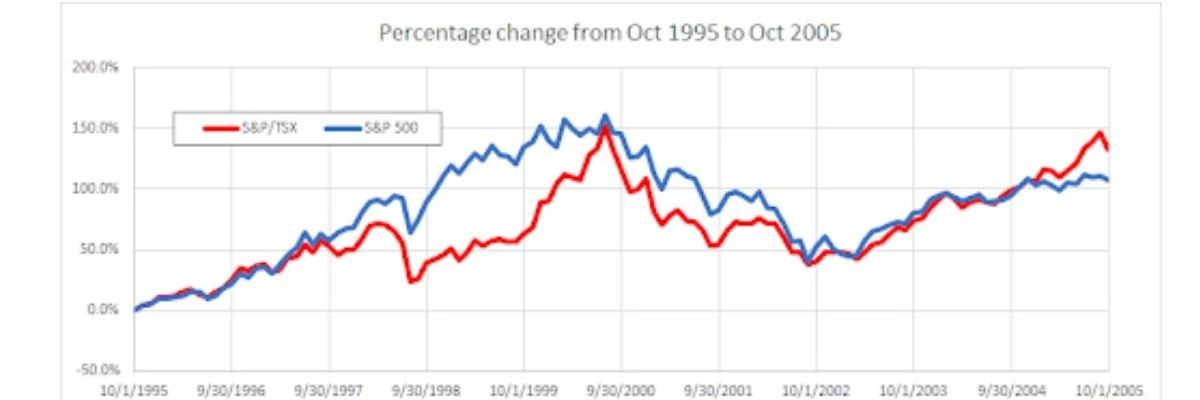
From October 1995 to October 2005, the Canadian index grew 132.9% while the U.S. index grew 107.6%. The respective average annual return is approximately 8.8% for Canada and 7.6% for the U.S.
This time period includes the exuberant speculation on technology companies that is the 2000 dot-com bubble (seen in the middle of the graph). The bursting of that bubble and the ensuing decline can be seen between 2000 and 2002. But the night looks darkest before dawn and both markets have recovered strongly since 2002.
It’s difficult to draw definitive conclusions from the above graphs. The U.S. stock market has certainly outgrown the Canadian stock market in the last ten years but there are periods where the Canadian market outperformed the U.S. market. The time periods in the above graphs are arbitrarily chosen.
It would be easy to find time periods where the Canadian stock market outperforms versus the U.S. stock market and time periods where the U.S. market outgrows the Canadian market. Also remember that the above graphs do not include dividend distributions (which would slightly favour Canadian dividend stocks).
There isn’t a clear winner to the Canadian stock market versus U.S. stock market fight!
In general, the Canadian and U.S. markets do seem to respond similarly to broad trends and big events. Both markets followed the boom-bust cycles in the last few decades, through the tech bubble, the financial crisis, the recent pandemic market decline, and the subsequent recovery. The magnitude of their respective responses sets the two markets apart.
Canada versus U.S. Stock Markets: What’s the difference?
In the Canadian stock market versus US stock market showdown, a number of factors come into play. First, size. Take all the stocks in an index, multiply their price with the number of shares, and you’d get the total market capitalization.
As of 2023, the TSX Composite has a market capitalization of 2.75 Trillion USD and the S&P 500 has a market capitalization of just over 32 Trillion USD.
Next, the Canadian and U.S. markets use different currencies. The fluctuations in relative values of the Canadian Dollar and the U.S. Dollar contribute to variations between the respective market index levels.
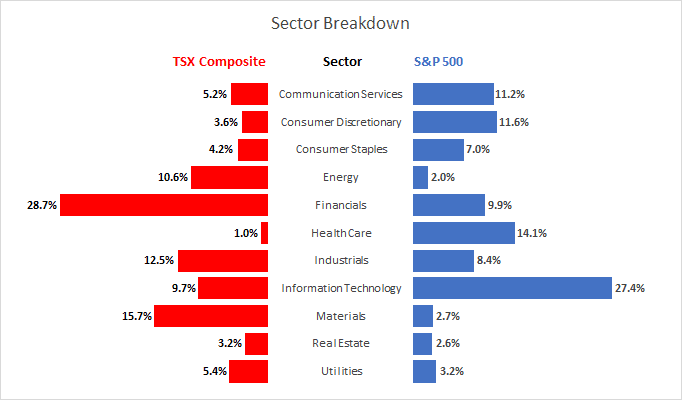
Finally, the third, most important factor that sets the Canadian and U.S. markets apart is composition. The two markets are simply made up of different companies in different sectors.
The Canadian market is mainly concentrated in financials (28.7%), materials (15.7%), industrials (12.5%), and energy (10.6%). The U.S. market is mainly focused on information technology (27.4%), healthcare (14.1%), consumer discretionary (11.6%), and communication services (11.2%).
Another way to get a sense of the different market composition is to look at the top constituents in each index. These are the companies that have the highest market capitalization (stock price times number of shares) in their respective index. The Canadian top ten is currently dominated by banks and the U.S. top ten is dominated by technology companies.
| TSX Composite Top Ten Constituents | S&P 500 Top Ten Constituents |
| Royal Bank of Canada | Apple Inc. |
| Toronto-Dominion Bank | Microsoft Corp |
| Shopify | Alphabet (Google) |
| Canadian National Railway Company | Amazon.com Inc. |
| Enbridge Inc. | NVIDIA Corporation |
| Canadian Pacific Railway | Berkshire Hathaway |
| Canadian Natural Resources Limited | Meta Platforms (Facebook) |
| Bank of Montreal | Tesla |
| Bank of Nova Scotia | Visa |
| Thomson Reuters Corporation | UnitedHealth Group Incorporated |
When comparing the Canadian vs US stock markets the most important difference is not just overall size, but the diversity of sectors. It is very important to understand that the US stock market includes many large tech companies and large private healthcare companies.
I think it’s fair to say that these two sectors represent excellent long-term growth opportunities, and that for an investor to get the full benefits of diversification, they should have some exposure there.
If you’re like me, you’ll want a fair helping of the best Canadian dividend stocks in your portfolio (especially in your non-registered account), and from there you can pick a few large tech and healthcare companies from the USA, or simply use a US ETF to get exposure to the entire US stock market in one easy purchase. You can find some great options for US exposure in our Best ETFs in Canada article.
Investing in the U.S. Market For Canadians
The easiest way to invest in the U.S. market is to log in to your discount brokerage like Qtrade, and buy an index ETF like XUS (from iShares) or VFV (from Vanguard). Both those ETFs hold U.S. stocks and aim to closely track the S&P 500 index. But those ETFs trade on the Canadian stock exchange and can be purchased using Canadian Dollars.
From the Canadian perspective, XUS and VFV returns are also affected by fluctuations in the Canadian dollar relative to USD. There are currency hedged versions of U.S. index ETFs that try to counter or smooth out currency fluctuations.
Some examples are XSP from iShares and VSP from Vanguard. Generally, for committed, long term investors like MDJ readers, the currency hedged ETFs are not necessary and may even be a waste. This is a discussion for another article.
More sophisticated investors may also wish to hold their U.S. investments in USD and buy ETFs directly from the U.S. stock exchange. Holding U.S. domiciled stocks or ETFs from Canada can have complex tax implications. Even the tax sheltered TFSA accounts in Canada cannot totally shield the Canadian investor from U.S. withholding tax on dividends.
If you have the room, it’s most tax efficient to hold U.S. stocks and ETFs in your RRSP account. For more information, check our free eBook below called “Can I Retire Yet?” – which details where to hold your various types of equities.
I've Completed My Million Dollar Journey. Let Me Guide You Through Yours!
Sign up below to get a copy of our free eBook: Can I Retire Yet?






Excellent Article!
Other differences are order types allowed. The Canaian markets require stop limit orders, while the US allows stop orders without the limit component.
The TSX does not allow API orders (for some reason Questrade allows it from Medved Trader) but Interactive Brokers does not allow API acces for trades. The US markets allow API trades.
I swing trade mostly US markets. Tax is witheld in US for divedends but not capiall gains (you pay that when the profits get to Canada)
In taxable Canadian accounts, the US witholds 15% of your dividend from US companies. However, on your Canadian tax return, you also get to claim a foreign tax credit….
It is inadvisable though to hold US dividend paying stocks in a TFSA.