How to Calculate Annual Investment Returns Using XIRR
After my 2012 year end net worth update, there was some chatter about how to properly calculate annual investment returns. The fact is that there are a number of ways to calculate annual investment returns, some easier than others.
For example, if you have a starting portfolio value and an ending portfolio value for a particular year and no contributions or withdrawals, it’s a relatively simple calculation. In this case, a simple brute force way to calculate a return that I use often is:
[Ending portfolio value (Dec 31st of current year)/Starting portfolio value (Dec 31st of previous year)] – 1
If my portfolio is worth $120,000 at year end but started at $100,000, then my annual investment return is 20%.
However, in most situations, investors add and remove capital from particular investment accounts which can weigh on investment returns. This is where it can get tricky to calculate manually, so I like to use a trusty spreadsheet to do the work for me. Specifically, the XIRR function.
The XIRR Function
The XIRR function is similar to the IRR (internal rate of return) function but is more robust. IRR allows for the calculation of returns with “regular” contributions, but XIRR allows for random contributions or withdrawals throughout the year. The real beauty is that you do not need to be a spreadsheet guru to use these functions.
The Syntax for the function is:
Excel: XIRR(values, dates, [guess]) Open Office: XIRR(values; dates; [guess])
Values are the range of portfolio values; Dates are the range of dates; and Guess is an approximate percentage return (optional).
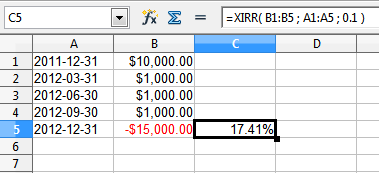
Here is an example from Canadian Money Forum using Open Office;

To use this function, you’ll need to gather some information on your investment portfolio:
- Value of portfolio at the end of the previous year (put positive number in spreadsheet)
- Value of portfolio at the end of the current year (put negative number in spreadsheet)
- Date(s) and amount(s) of contribution(s) to the account (put postive number in spreadsheet)
- Date(s) and amount(s) of withdrawal(s) from the account (put negative number in spreadsheet)
In this example, at the end of 2011, the portfolio value was $10,000. Throughout 2012, there were 3 contributions to the account at various times in the amount of $1,000. The final value at the end of 2012 was $15,000. Using the XIRR function, the return for this portfolio is 17.41%. If you were to simply subtract the $3,000 in contributions from the end value, then the return would be an overstated 20%.
Another example is with my leveraged dividend portfolio. In 2011, the portfolio ended with $87,500 in value. There was a $10,000 contribution at the end of August 2012, and the end value for 2012 was $108,000. Punching it all into the XIRR function shows a 11.5% return for the year.
There you have it, a relatively easy way to calculate your annual investment returns. Let me know the XIRR function works out for you.


is there a particular date format to be used?
i keep getting “#num!” error?
Good stuff! I agree not a lot of people know how to calculate their investment returns. Though, I can’t think of a good reason why would one need to include in xirr calculations current holdings since they are not finalized yet (i.e sold). It probably makes sense to calculate ROI on the current individual holdings. I calculate xirr on my past investments to understand my investment performsnce. I use the following two column format:
Transaction date – proceeds (positive # for proceeds from sale of securities and cash dividends and negative # for proceeds from buying the securities). This way I don’t care about portfolio starting values as xirr spits annualized returns anyway. If anyone has any suggestions, feel free to critique.
@mr_l, the problem is that the individual xirr outputs will be in different spreadsheets, and it is a hassle to bring them all into a single spreadsheet …
@K if you have the data to perform xirr on several investments then you could just do an xirr calculation that uses all the data as input to get the annual return for your entire portfolio, no?
Does anyone know how to combine the output of multiple XIRR() outputs? This way, we can not only find the rate of return of individual investments, but also of the entire portfolio.
Thanks Michael for reverting.
While this is strange I continue to get the difference. Is there a way you could email me your excel sheet. I could in turn revert with my working on both CAGR and XIRR. You could email it to me at support@newhorizonfunds.com.
Not sure if the version makes a difference as we used Excel 2003 or whether some amendments need to be carried out in the settings/ options
Thanks for assistance
Bill
@Bill: I get 20.67% when I calculate the IRR with the excel XIRR() function.
I have a peculiar problem wherein the CAGR return and the XIRR return both vary for the same data points.
Illustration: Investment of 50mn as at Sep 15, 2010 equals to 97.290 as at Mar 31, 2014. The XIRR function provides 21.2% performance for the period and the CAGR formula provides 20.6%.
Which is the correct number to consider and can someone explain the reason for this variation between CAGR and XIRR
How stupid of me not to see the fact that XIRR compounds!
Thank you Michael for your response.
Edward
@Edward: XIRR is giving you the right answer. If you compound 10% for 2 years, the result is 21%, not 20%. Good luck.