Are You Too Focused on Risk Reduction Instead of Growth?

A few years ago, we held a client event that highlighted the difference between how different types of investors think. I had invited my favourite hedge fund manager and my favourite growth fund manager.
It was the contrast in their thinking that I found fascinating. The hedge fund manager was the true hedge fund type that tried to reduce risk and provide a mostly market-neutral, steady return. The growth fund manager was looking for index-beating long term out performance.
The hedge fund manager explained how minimizing losses and a “win by not losing” outlook can provide decent returns with a smoother ride. He showed a chart something like the one below to show how much of a gain you need to recover from a loss:
| Loss | Gain needed to recover | Theoretical years to recover |
| 10% | 11% | 1.1 |
| 20% | 25% | 2.3 |
| 30% | 43% | 3.8 |
| 40% | 67% | 5.4 |
| 50% | 100% | 7.3 |
Figure 1: Theoretical years to recover (10% compound annual RoR)
For example, if your investment falls by 30% from $100,000 to $70,000, you need a 43% gain to get the $70,000 back up to $100,000. Since the historical average stock market return is about 10% per year, it would take almost four “average” 10% years to recover. His point was that, if you can avoid or minimize losses, you can provide more consistent returns.
I noticed a few people in the audience nodding their heads in agreement with the low risk, comfortable message.
When he finished his talk, the growth fund manager rose and said: “What the last speaker said is absolutely true. The math is accurate. However, what he missed is that the stock markets do tend to recover. Large declines have historically been followed by large gains. The largest market crashes generally didn’t take any longer to recover than smaller ones.
He showed a table something like this. If you look at calendar years in the last 140 years, there have been 6 periods when there was a loss of more than 20%. Here they are in size order, followed by the recovery until the market was above its previous peak:
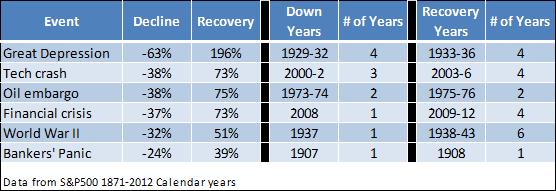
Figure 2: Historical Years to Recover after Largest Declines in History
He went on to point out that the years following large market crashes tend to have gains much higher than “average” 10% gains. The number of years to recover historically looked nothing like the theoretical years in chart 1. It is not a coincidence that the biggest bull market in history was from 1933-36, immediately after the largest bear market in history.
His main point was that the ups and downs are the cost of getting a higher long term return. Don’t fear the declines. The best returns usually are earned by investors that just stay confidently invested for the long term.
At this point, there was a murmur of insight from some in the audience.
After the presentations, I introduced the two fund managers to each other and, after some pleasantries, they continued their debate. The hedge fund guy pointed out that the chart showed periods of 6 or 8 years with no growth, during which his steadier fund would have made money. The growth manager countered that these are the 6 worst periods in 140 years. The 12 down years were less than 10% of the time. The other 90% of the time, the growth fund would have performed better most of the time.
I found it interesting that not only did the fund managers have different viewpoints, but most of the audience preferred one view or the other. I knew everyone in the audience, and could see that part of this was from the level of risk they were comfortable with, but part reflected their outlook on the world and on life.
Since that event, I have noticed these differing viewpoints in many fund managers. One is pessimistic and focused on avoiding losses first, while the other is optimistic and confident in long term growth.
I have also noticed that in different time periods, one or the other view becomes much more popular. During most of the 1990s, the optimistic, growth view was most popular with investors, while the pessimistic, defensive view has been more popular since 2008.
Which outlook speaks to you, and have you fully considered the implications for your investing success?


Hi Harry,
I agree. Keep a balance between risk & growth.
Incidentally, the market has historically been consistent in recovering from bear markets. Other than the 1929-32 crash, when there has been calendar year with a loss of more than 20%, the very next year has always been a gain of more than 20% (S&P since 1871).
It pays off to be confident in your investments and to think long term.
Ed
I agree with what the mutual fund manager said to an extent because usually whenever we have seen a large decline in the stock markets, especially during times of recession, with investors’ wealth plunging and severe notional losses being seen, the market has tended to recover equally quickly in the following years. However one cannot make an outright declaration based on this alone, so one has to be careful about keeping the right balance between risk and growth.
The Prime example of the power of investing in Private Equity vs. public equity:
In 1902, the Dodge Bros. invested $10,000 in the Ford Co.
By 1919, they had exited all Ford positions with gross returns of $55 million — a 550,000% return (as well as building their own $200 million auto company with Ford dividends).
The Ford Co. didn’t go public until 1956.
If you bought $10,000 (inflation adjusted) worth of Ford IPO, today, almost 60 years later, your initial investment would have returned ~$3 million (DRIP et al) or ~9,600%.
[note: dirty calculations, please feel free to correct]
Pitting equal amounts invested, the Private Equity investment returned over 540,000% more than the public equity investment, and in 1/3rd the time.
The Dodge deal is considered the most profitable investment deal in US history.
A perfect example of how important it is for your money to be as close as possible to the center of profit.
Please provide a real life instance of i) a dividend-paying stock portfolio and/or ii) a portfolio which contained ALL issues of either S&P index (90 or 233) from 1929-1950+.
*NOT* a theoretical model, but an actual and true portfolio held by the average household. Heck, I’ll even accept the real stock portfolio held by the wealthy of the day.
Thanks!
Hi Derek (#18). Anybody that says the stock market did not recover from 1929 until after WWII is omitting the dividends. They use the price only index, which excludes the payment of dividends. Not just the reinvestment of the dividends but the payment of the dividends. It assumes you owned the stocks in the index but did not include the dividends you received.
At that time, the average dividend payout was higher than today – it was about 5%. So those charts are missing 5%/year of the stock market return.
You always need to be careful with stock market indexes as to whether you are looking at the base index (price only) or the total return index (which includes the dividends).
Ed
@Derek: read #13 for the answer to your “reinvesting the dividends” question.
Agree with #1 and #4 – I’ve always heard that we didn’t return to the 1929 high until after WW2. Maybe that wasn’t factoring in reinvesting the dividends?!?
re: #16 — 1. “For my portfolio I calculate the usual stats like beta, alpha, std dev, sharpe ration, r squared, etc….I do the usual filters with valuations on individual securities or funds to make sure they still fit my risk profile.”
2. “The non systemic and systemic risk items you mentioned are always the outliers (although they happen more and more often) that I try to build in margins of error for.”
Sounds like you have a lot of bases covered. I will ask why you don’t put more risk analysis emphasis on “the outliers” as it those which effectively make the market. They are not outliers if they permeate and dictate the market.
Your evaluations of “individual securities or funds” is great but you have to know by now that you are not actually buying the underlying company — you are buying into the market place.
Eg. there is a 180-degree difference between you buying Nokia stock and thinking you are buying the company, and Bill Gates actually buying Nokia the company.
Eg. Suncor was pumping oil when oil was $140pb; their stock (SU) was valued at $70. Suncor was pumping oil when oil plummeted to $30pb; the stock fell to $20. No difference in the behaviour of the underlying company, -70% difference in the behaviour of the stock.
Last time oil was at $100, SU was at $50; what is now undervalued, the stock or the company?
Eg. Buffett dumps $500 million into SU stock, the stock rises 10% two months later when the information is made public. Did company risk all of a sudden decrease? Why did the stock not rise upon initial purchase instead of upon public report?
Even though not everyone died, it would have been nice to know about that iceberg. ;)
@sst now I understand, bear with me as I am using a phone haha. The following is in no particular order ;)
For my portfolio I calculate the usual stats like beta, alpha, std dev, sharpe ration, r squared, etc. as a basic measure to benchmark myself as a PM for my own funds.
I then use some computational finance methods to measure a few other figures just to get some non biased info (see Cornelious Los’ work if you want a light read lol had him as a professor in university. Lots of theories but some legitimate ways to “unbias” bias financial information)).
I do the usual filters with valuations on individual securities or funds to make sure they still fit my risk profile. I also regularly review the other standard stuff like am I “diversified enough” I am taking advantage of private equity or purchasing more businesses. I also make sure I document the time I spend doing this type of stuff as my time is valuable and needs to be factored in haha otherwise I risk the doghouse with the wife lol The non systemic and systemic risk items you mentioned are always the outliers (although they happen more and more often) that I try to build in margins of error for.
Not one thing works by itself but together it gives me at least a basic snapshot of how I am performing as my own PM and if I am managing things efficiently… regardless of asset or asset class. The big things are that I am always evolving my metrics and that I am even documenting anything at all. Sorry for the butchered response but typing on an iphone is a pain in the arse haha
Talking about your personal “metric for risk” and the measurement of it.
What is your definition of investment risk and how do you measure it?
And if your brackets of risk and measurement contain none of the items on my list, why or why not?
Thanks.